Creating a Principal® registered index-linked annuity (RILA) strategy
 strategy")
The flexibility of a Principal® RILA means clients can personalize an investment strategy that meets their needs. But with all the different levers available, it might be hard to visualize how it all works.
We’ve put together some examples to show how the different accumulation strategies and protection levels could affect an initial investment of $100,000.
All examples are hypothetical and purely educational.
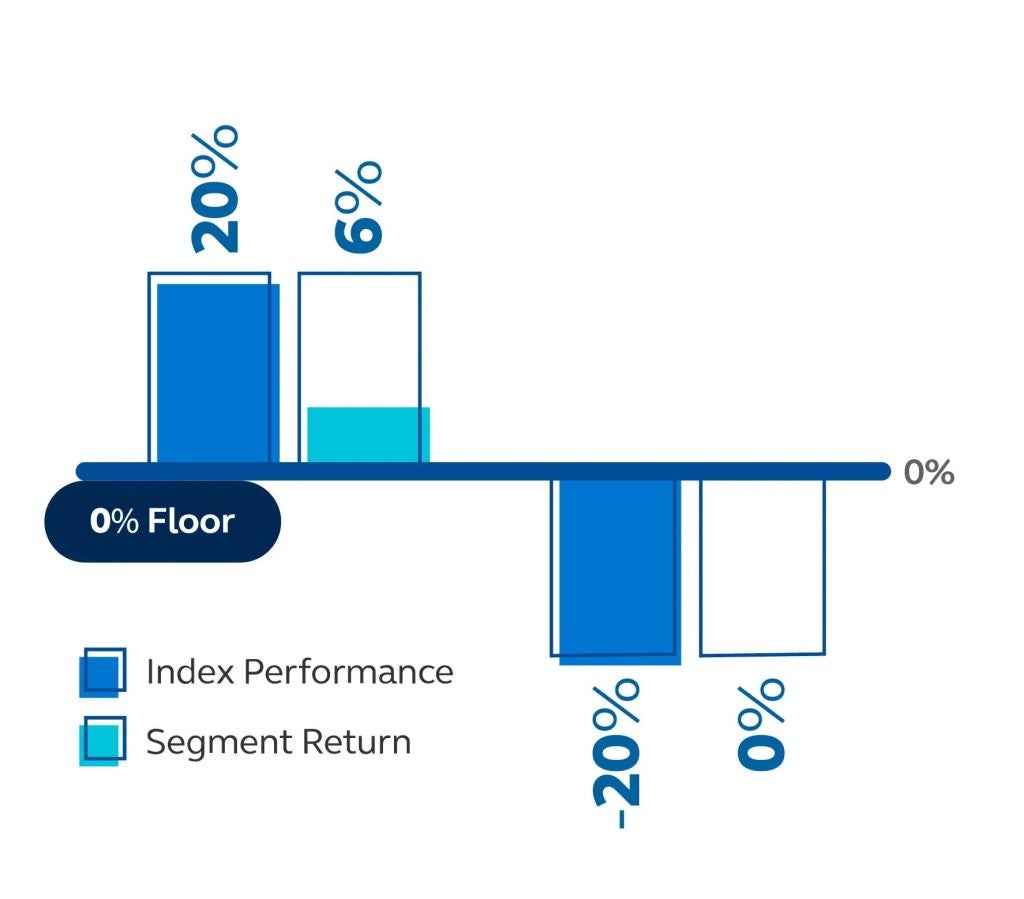
Peak 20% buffer with a participation rate
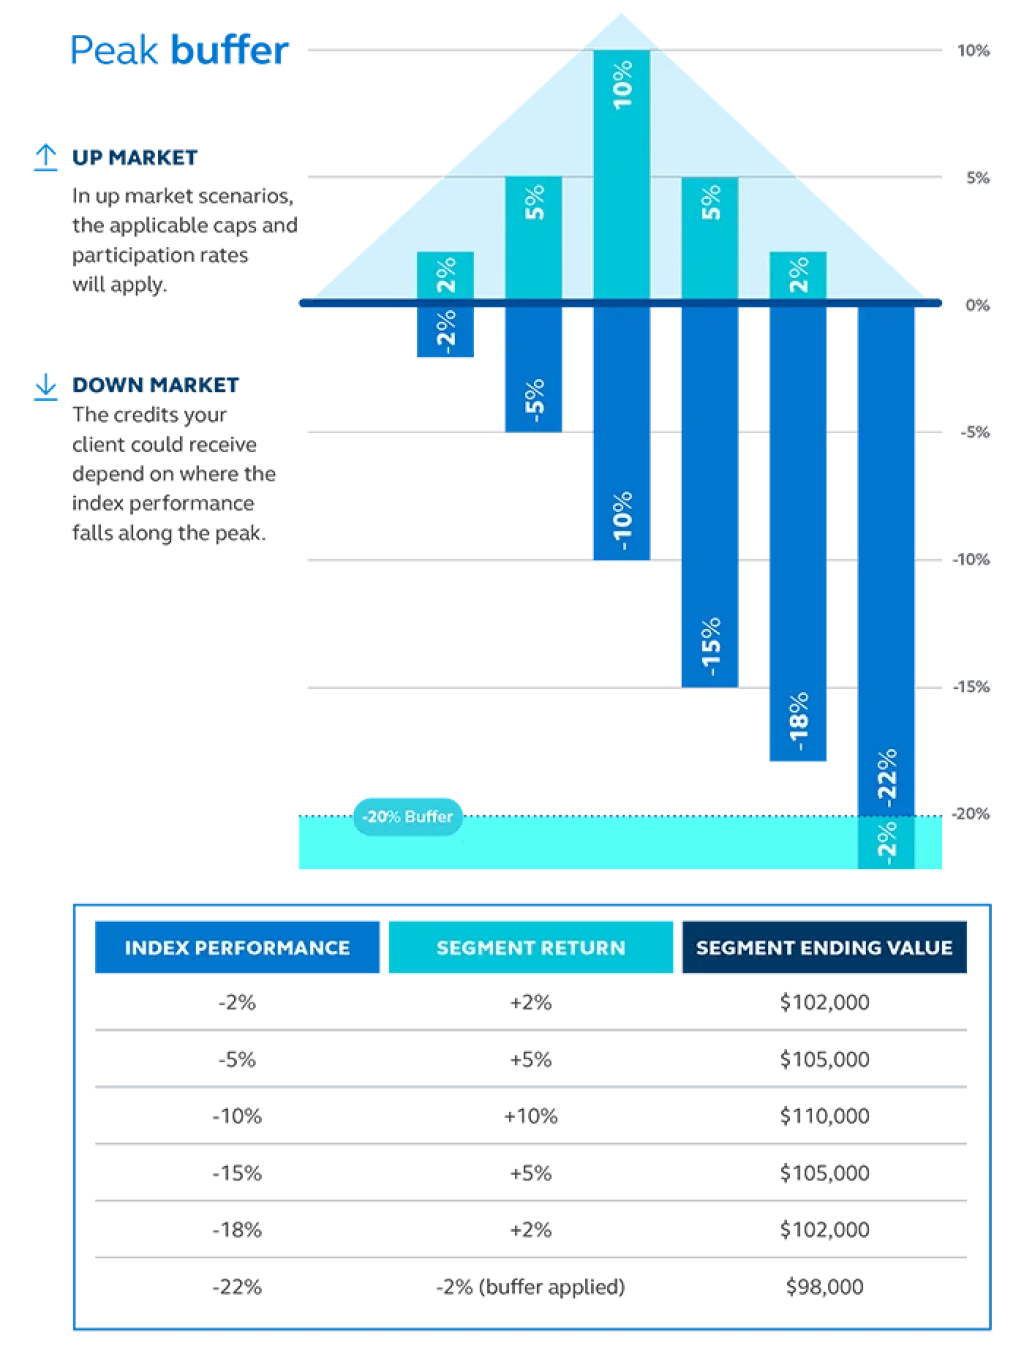
These figures are hypothetical and do not guarantee any future returns nor represent the performance of any particular investment.
These examples are for illustrative purposes only.
Up market scenario
The index performance
is +20% with 100%
participation rate. Your
return would be +20%.
_____
Your ending value
$120,000
These figures are hypothetical and do not guarantee any future returns nor represent the performance of any particular investment.
These examples are for illustrative purposes only.
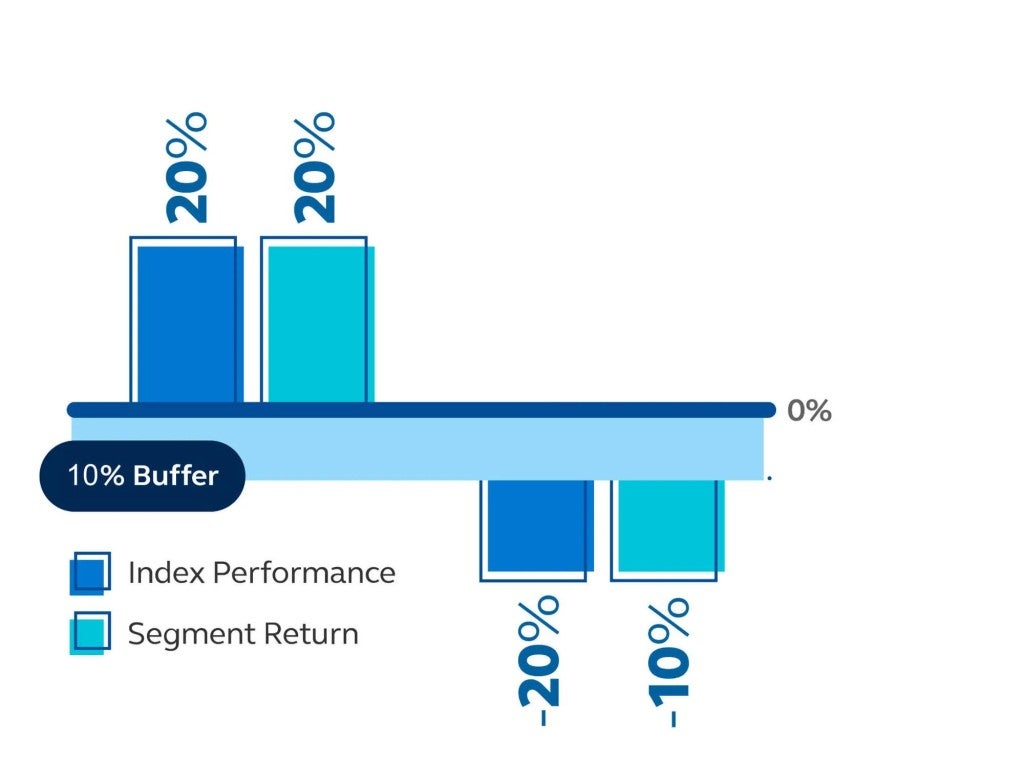
Down market scenario
The index is down -20%
with a 10% buffer. The
return would be -10%.
_____
Your ending value
$90,000
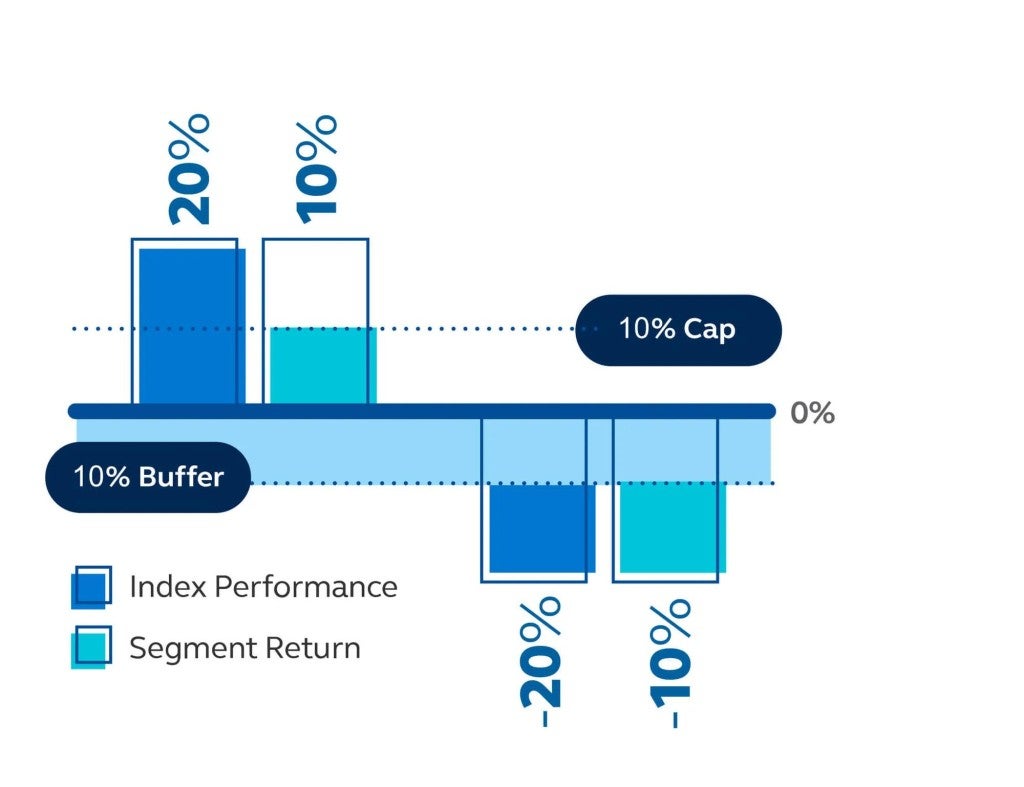
Up market scenario
The index performance
is +20% with 10% cap.
Your return would be
+10%.
_____
Your ending value
$110,000
These figures are hypothetical and do not guarantee any future returns nor represent the performance of any particular investment.
These examples are for illustrative purposes only.
Down market scenario
The index performance is
-20%. With a 10% buffer
your return would be
-10%.
_____
Your ending value
$90,000
Up market scenario
The index performance
is +20% with a 30%
participation rate. Your
return would be +6%.
_____
Your ending value
$106,000
These figures are hypothetical and do not guarantee any future returns nor represent the performance of any particular investment.
These examples are for illustrative purposes only.
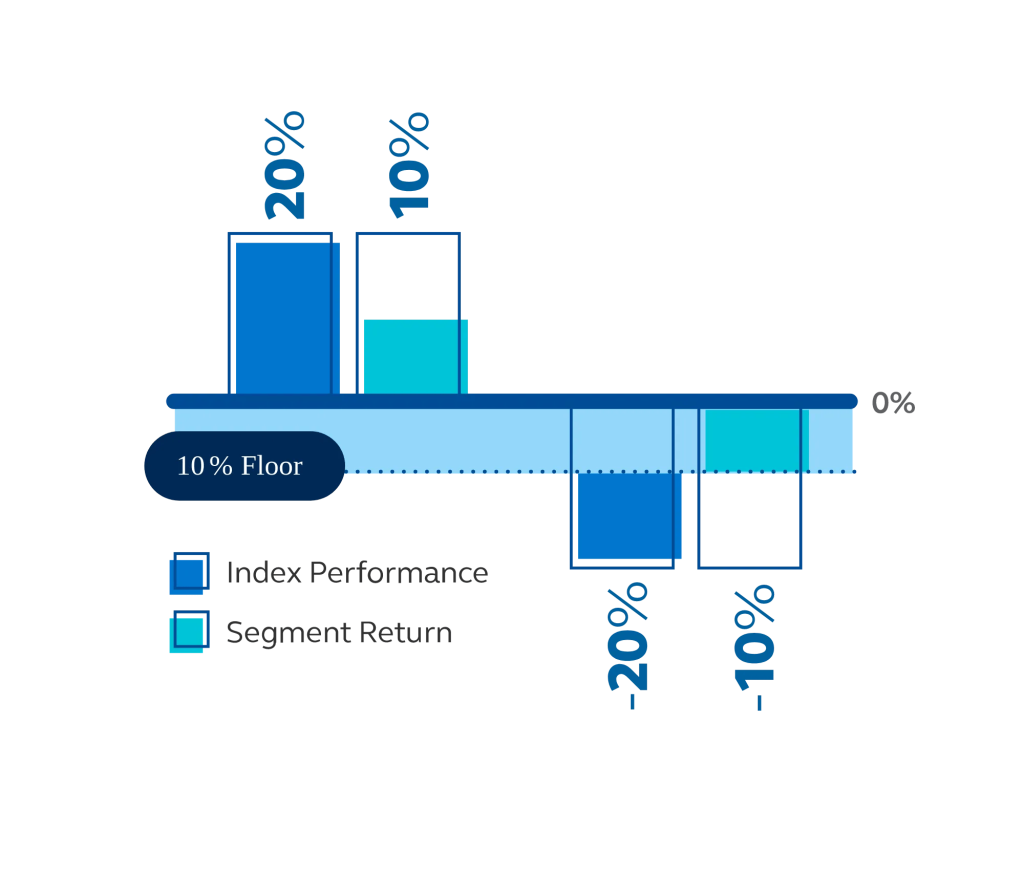
Down market scenario
The index performance is
-20% with a 0% floor. Your
return would be 0%.
_____
Your ending value
$100,000
* Any early withdrawals taken before the segment end date will result in different account values.
A quick guide to the segment options
This chart provides a handy reference to keep track of the different segment options. The MSCI EAFE index segments are not available with Principal® Strategic Income.
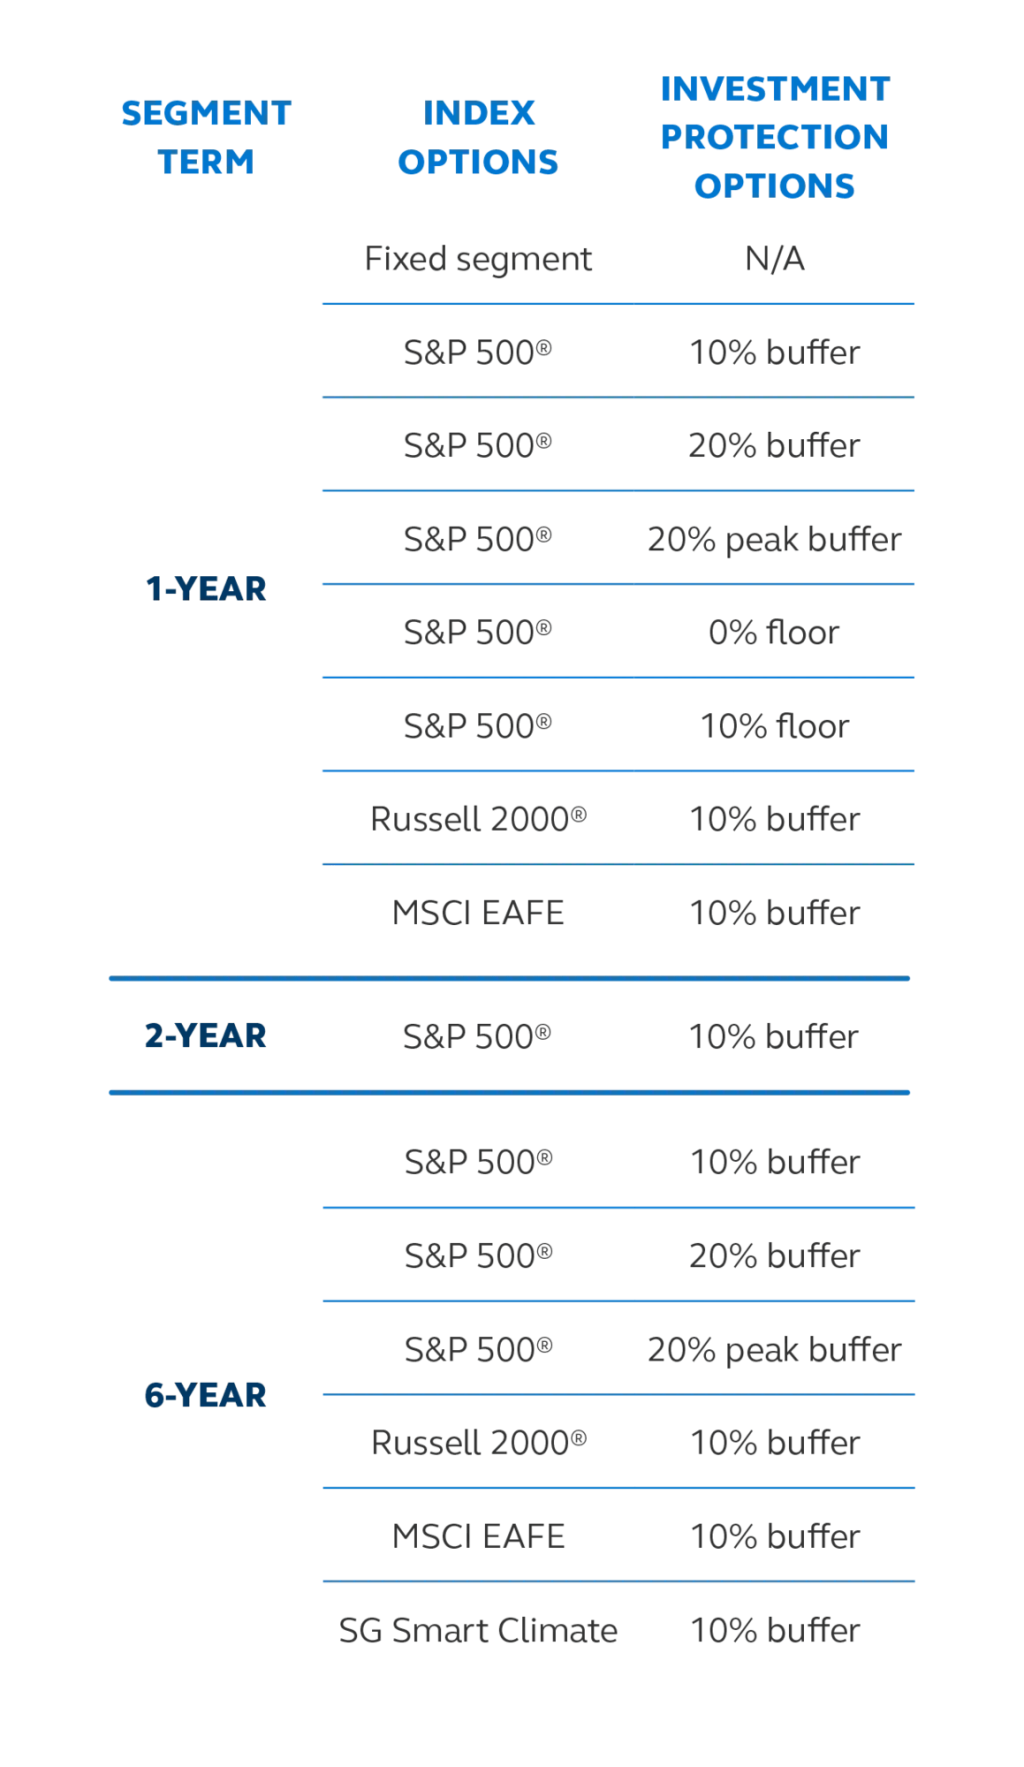
If the accumulated value is allocated when a segment reaches its end date, funds may be transferred to another segment. If a new segment is not elected, the segment will renew into the existing segment if it's available. If that segment is no longer available, we will select a new segment, based on the terms outlined in the contract.
If the accumulated value is allocated to the fixed segment option, the value of that segment at any time will be equal to the accumulated value allocated on the fixed segment start date, plus interest during the segment term and minus any amount deducted during the segment term.
Learn more
Ready to help clients plan their retirement income?
Give us a call:
Send us an email
Find your wholesaler (PDF)